Monday, October 28, 2013

A Different Perspective

by Jeffrey Saut

In last Tuesday’s Wall Street Journal there was a story titled “No Rocket? Venture to Sell Balloon Trip Into Space.” The article began, “Space tourism may not be rocket science after all. An Arizona company wants to develop high-altitude balloons to send thrill seekers to the edge of Earth’s atmosphere. The trips would cost less than other proposed space jaunts, but passengers wouldn’t experience the same intensity of weightlessness.” The article reminded me of another encounter that happened years ago. I like this story by Jeff Bowden from Living Legends (as paraphrased):
Years ago I heard a Dick Bass story. Bass, who is no relation to the Basses of Fort Worth, is a Dallas oilman, adventurer, and developer of the Snowbird Ski Resort in Utah. In the story, Bass gets on a transcontinental flight. As he sits down in first-class, his seatmate recognizes him. “I just read your book, Seven Summits,” the plain-looking man gushes. “I loved it.” An unlikely flatlander, Dick Bass was the first person to climb the tallest mountain on each of the seven continents. Bass proceeds to hypnotize his admirer for the next three hours. He talks him up Mount McKinley, up Aconcagua in South America, and up Mount Vinson in Antarctica, where Bass’ group was only the third party in history to climb the most remote of the seven summits. Eventually Bass has the man teetering on a knife-edged ridge on Mount Everest at very nearly the same altitude as the airliner. (Bass notes that things take on a whole different perspective looking down from a high mountain peak). At the point at which the captain informs the passengers to raise tray tables and seatbacks, Bass abruptly stops talking. “I just realized,” he says, horrified. “I’ve been talking about myself the entire flight. I haven’t asked anything about you.” Surely the man had a favorite outdoor story. Perhaps a bear carrying off an ice chest. “I haven’t even asked your name,” Bass says. “Oh, that’s okay,” responds his good-natured companion, offering his hand. “I’m Neil Armstrong.”
Indeed, one gets a different perspective when things are viewed from high places. The starship Enterprise sought, “To boldly go where no man has gone before,” and last week the stock market boldly went where it has seldom gone before. Indeed, in last Thursday’s Morning Tack I referenced the fact that all 10 of the S&P macro sectors were overbought, and overbought by more than two standard deviations above their respective 50-day moving averages (DMAs). As the invaluable Bespoke organization writes:
It is not too common for even one sector to trade two standard deviations above its 50-DMA (45% of all trading days), but to have the S&P 500 and all ten sectors trading at these levels simultaneously is practically unheard of. This event is so rare in fact, that going back to 1990, there have only been two other days where we have seen similar readings! . . . [The] first occurrence came in the aftermath of the first Gulf War on 2/11/91. The second occurrence came on 12/29/03 in the early stages of the prior bull market. Back then, there was no major catalyst driving the rally besides some stronger than expected economic data and the typical seasonal strength that is common towards the end of the year. Leading up to the 2/11/91 occurrence, the S&P 500 rallied 17% in just four weeks. However, even after that rally, equities did not see any meaningful pullback over the following year. While the momentum slowed, over the next year the S&P 500 never traded more than 2% below the closing level from 2/11/91.
If that is the way it is going to play this time, it implies this “bull move” could extend a lot longer than most think. In past reports I have commented that many pundits have suggested this “bull” is long of tooth at 56 months. And, measuring from the March 2009 nominal price low that would be true. But, just like the D-J Industrial Average (INDU/15570.28) made its nominal price low at 577 in December of 1974, it did not make its valuation low until August of 1982; and most market observers measure the beginning of the 1982 to 2000 secular bull market from that August 1982 valuation low. Fast forward, I believe the 12-year trading range market (similarly to the 1966 – 1982 trading range market) made its valuation low in March of 2009. However, as repeatedly stated I think the valuation low occurred with the “under cut” low of October 4, 2011, which was identified in these missives. Measuring from there shows we are only 24 months into this “bull.”
While it’s true my timing models, which targeted late summer as a window of vulnerability (even though we didn’t get the 10% pullback I was looking for), are now calling for another downside window from mid-November into early December, I would expect any hesitation to be similar to what we got last summer. Given that view, how do we invest with the potential for a stutter-step in November? Well, one place to start is with the 10 S&P macro sectors. Currently, the S&P 500 (SPX/1759.77) is trading at 16.4x this year’s bottom-up operating earnings estimate. Looking at the P/E ratios of the 10 macro sectors shows that only the Financials (13.4x), Energy (13.8x), and Utilities (16.1x) are trading at a discount to the SPX. On the Energy theme, only three stocks in Raymond James’ research universe have a Strong Buy rating from our fundamental analysts, and screen bullishly using my proprietary models: Enterprise Products Partners (EPD/$64.48); Memorial Production Partners (MEMP/$21.11); and Valero Energy (VLO/$39.44). Raymond James covers many Strong Buy-rated names in the Financials complex, and these seven also screen well by my system: Everbank Financial (EVER/$15.29); Huntington Bancshares (HBAN/$8.93); Lakeland Financial (LKFN/$35.19); New York Community Bancorp (NYCB/$16.08); Private Bancorp (PVTB/$24.95); Webster Financial (WBS/$28.59); and Wintrust Financial (WTFC/$44.14). I would put these names on your watch list for potential purchase. Since we have no fundamental analyst covering Utilities, I suggest contacting our Exchange Traded Fund research department for the appropriate ETF.
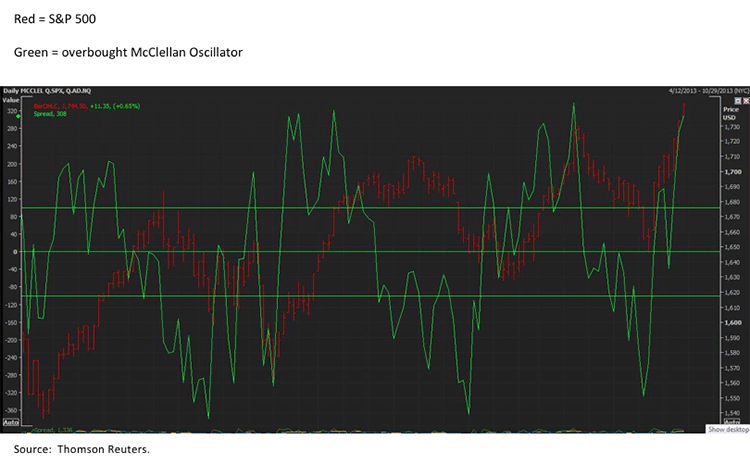
The call for this week: Last week just about all of the indices I monitor made new all-time highs except for INDU and the COMP. Likewise, seven of the S&P’s 10 macro sectors made new all-time highs with the exceptions being Consumer Staples, Telecommunications, and Utilities. Moreover, despite predictions of imminent disaster for stocks there is little evidence suggesting a sudden collapse is at hand. Indeed, the Buying Power Index is above its September highs, while the Selling Pressure Index recorded a new low last week, and all of the Advance/Decline Lines I look at rose to new highs. Accordingly, the short-term “buy signal” that occurred on October 10th remains in force. Surprisingly, given last week’s strength, the McClellan Oscillator became less overbought. And don’t look now, but 63.5% of companies reporting earnings have beaten the estimates and 54.4% have beaten revenue estimates. This morning there are more stories about no tapering by the Fed this year, a stance I have taken since last August. That sense is what buoyed stocks late last week and it is having the same effect this morning.

Friday, October 25, 2013

The Boys Are Back in Town

by Jeffrey Saut

“The Boys Are Back in Town”
Guess who just got back today?
Them wild-eyed boys that had been away
Haven't changed, haven't much to say
But man, I still think them cats are crazy
They were asking if you were around
How you was, where you could be found
Told them you were living downtown
Driving all the old men crazy
The boys are back in town
... Thin Lizzy (1976)
The boys are indeed back in town as Washington D.C. opened its doors for business as usual last week following a contentious debt ceiling debate and a 16-day shutdown of the government. This outcome had been anticipated in these letters for often-stated reasons, and just like when the ”fiscal cliff” was averted, I now expect the media to turn its focus to the next Armageddon. While the self-inflicted crisis took the amateurish rollout of Obamacare out of the headlines, it will likely have a de minimis effect on the economy (maybe shave 0.03 – 0.04% off of the official GDP figures). The good news is that except for this week’s delayed September employment report, I doubt investors will pay much attention to any of the other economic reports between now and Christmas due to the recent Beltway consternations and their expectation about the potential impact on the economy.
As for the impact on the stock market, it was profound with the S&P 500 (SPX/1744.50), the mid-cap S&P 400, and the small-cap Russell 2000 trading to new all-time highs. While there were some upside non-confirmations (most notably the D-J Industrial Average), the majority of indications confirmed the move higher. For example, the Advance/Decline Line climbed to a new bull market high, the Selling Pressure Index fell to a new reaction low, the short-term “buy signal” I spoke of on October 15th remains in force (when the 14-day Stochastic crossed above its moving average), the Short-Term Trading Index confirms that “buy signal,” the number of new highs on the NYSE expanded, and the list goes on. Such metrics caused the “godfather of technical analysis,” namely Ralph Acampora, to abandon his bearish “call” of last summer. Recall that like me, Ralph was looking for a short/intermediate-term stock market peak in the mid-July through mid-August timeframe. At the time I was expecting a decline of roughly 10%. And, we were about halfway into that 10% pullback when Vladimir Putin pulled our President out of a tight spot with Putin’s Syrian solution. At that point I mainly gave up on my downside “call” and recommended recommitting 15% of the cash that was raised in June. Since then, while the equity markets have been choppy, they have refused to surrender much ground. As stated in last Thursday’s Morning Tack, “With the debt ceiling debates behind us, the markets can focus on earnings, economics, and the Federal Reserve.” To that trifecta, the story is pretty good.
On the earnings front, the bottom up operating earnings estimate for the SPX is currently $107.58, leaving the SPX’s P/E ratio at almost 16x. Next year’s estimate is $121.66. If the SPX continues to trade at that P/E multiple it renders a price target of 1946. Moreover, so far of the 190 companies that have reported earnings, 60.5% of those companies have beaten estimates and 50.9% have beaten revenue estimates. As far as economics, as stated the numbers are probably going to be ignored for a few months because of the shutdown. However, I believe GDP growth will accelerate to 3% in 2014 driven by a capital expenditure cycle because companies like GM are running their plants flat out 24/7 and the equipment is wearing out. Finally, with Janet Yellen at the helm of the Fed it should be steady as you go. That implies no tapering and plenty of liquidity. And, a number of other things are going right in this country.
While the politicians do not want to broadcast it, the latest monthly CBO report shows tax revenues up 13% year/year and individual income tax payments up an amazing 15.8%. Further, payroll taxes are better by 11.6%, all of which have cut the CBO’s 2013 estimate of the deficit to $642 billion. Part of the reason for that deficit reduction is because median family annual incomes have stabilized for the first time since the recession to an inflation-adjusted $51,017. Another reason is that the U.S. is on track to overtake Russia as the world’s largest producer of oil and natural gas. Of course the reason for that energy leap is the technologies of fracking and horizontal drilling. Interestingly, the research firm IHS Global Insights notes fracking has added the equivalent of $1,200 to real household disposable income on average in 2012 and estimates that figure will grow to $3,500 by 2025. Further, fracking added $283 billion to economic growth last year and is expected to add $533 billion in 2025 with an attendant federal/state tax payment of $138 billion. The relative resulting “cheap” energy estimates are causing foreign companies to invest, or are planning to invest, billions of dollars in plants that would churn out chemicals, fertilizers, plastics, metals, etc. Obviously, the American Industrial Renaissance (AIR) is happening. A few of the ways to participate in this renaissance is through Rich Bernstein and either of the mutual funds he manages for Eaton Vance, Richard Bernstein Equity Strategy Fund (ERBAX/$13.62) and the Richard Bernstein All Asset Strategy Fund (EARAX/$12.24). As for a pure play (100%) on AIR, there is First Trust’s Richard Bernstein TS American Industrial Renaissance ETF (FWRVLX/$10.17).
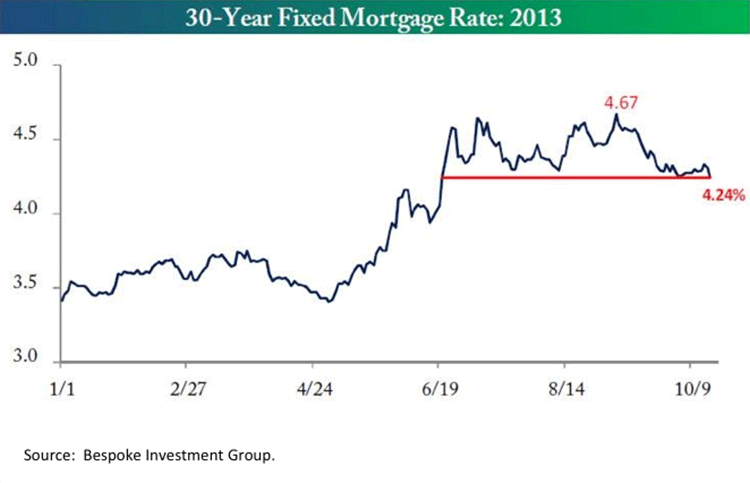
Another theme we have embraced for the past two years has been the recovery in housing. Recently many investors have cooled on this theme due to the rise in mortgage rates. However, as can be seen in the chart on page 3, mortgage rates have declined over the past few weeks. A second derivative way to get at the burgeoning housing theme is via Strong Buy-rated Weyerhaeuser (WY/$30.11). As our fundamental analyst writes in the commentary for ourAnalysts’ Current Favorites product, released earlier today:
We believe: 1) the embedded value of Weyerhaeuser’s homebuilding platform is underappreciated relative to other public builder valuations (most notably, the 17,700 lots it controls in California); 2) the recent underperformance of WY shares has created a buying opportunity; and 3) in the context of our REIT coverage, there are relatively few opportunities to find similar long-term earnings/cash flow growth stories. In our view, Weyerhaeuser’s homebuilding platform (one of the 20 largest in the country), significant wood products business, and immense timberland portfolio position it as a compelling alternative to pure-play homebuilders in this housing recovery. Weyerhaeuser is targeting a payout of 75% of FAD over the cycle and is well positioned to raise its dividend as the housing recovery gains momentum. The company has already boosted its dividend by 33% since October (WY shares currently yield ~3%).
The call for this week: According to the weight of the evidence, the primary stock market trend remains “up!” Indeed, last Thursday’s gain, while not a 90% Upside Day, was indeed an 80% Upside Day as the market breadth, and total points gained, were decidedly positive. Manifestly, since 1940 there have only been 45 other days when 80% of issues and volume were positive and the SPX closed at a new 52-week high (like happened last week). Of those, only seven occurred two days in a row. According to the must have SentimenTrader folks, “To get more precedents, let's look for any time that both the percentage of up issues and volume were both above 75%, with the last one occurring on a day the S&P closed at a new high. In 73 years, there have been 17 precedents. A week later, there were only three negative returns, and two of those were less than -0.5%. Three months later, there was essentially only one negative return, as was the case six months later was well. Average returns were about double what a random return was during the study period.” Verily, the only current negatives are the short-term overbought condition (see chart on page 3) and the upside non-confirmations.

AUD.USD

A Global Minsky Moment Ahead 

By John R. Taylor

Last night I participated in a discussion of John Mauldin and Jonathan Tepper’s new book, Code Red, where the talk was dominated by the mindset of today’s Central Bankers, which I would categorize in two ways.  The first is that the answer to any problem is to throw money at it and the second is that the people and societies of the world are too weak, physically as well as mentally, to survive the rigors of economic cycles.  We are all children to them who need to be protected from the realities of the harsh world.  Despite the vast majority decrying the folly of the money printing way of life, almost everyone accepted this was what the future would look like.  Summing it up was a quote from Larry Lindsay saying that if $1 trillion per annum was not enough to forestall a recession, “just raise it to $2 trillion.” Don’t people remember that debt, once taken on, must be repaid? The conclusion seemed to be that inflation was ahead – eventually – and buy things that do well in inflation. I can’t agree. Debt repudiation is possibly more likely, but then again that might come after an inflation scare.  In any case, it’s all a guess.  Remember, what will happen next has never happened before.

Don’t think the US is the only one approaching crisis because of its increasing debt burden. Although the US might be the epicenter because the dollar is the world’s currency, this problem is worse in Europe, Japan and China. Remember John Connally who said “The dollar is our currency, but your problem,” he was prophetic. The flood of dollars since its floating in 1973 has been the major factor in the growth of debt levels world-wide. But individual economies are more or less able to handle the increasing availability of debt capital. Those slow-growing economies with large public sectors were the least able to recycle the money into profitable end uses and growth.  As a result they were the first to enter the Ponzi stage of the Minsky cycle where new borrowings were taken just to pay the interest on the old ones. The further into the Minsky cycle one goes, the harder it is to generate positive growth until it is impossible. Europe is ahead of the US and is already suffering from a slow-motion economic and social collapse. The debt load of the sovereigns, the corporates and the public is still expanding as the continent’s balance sheet recession deepens.  As there is no way to generate positive economic statistics, it seems deflation and debt repudiation is the likely course of events.  In Asia, the Japanese seem to have made a decision similar to the US, as they are moving their debt purchases further out the curve, promising to buy for the long-term, and are pushing their currency lower to stimulate inflation, export growth, and jobs. In each, the growth of national debt levels is far outpacing the economy in already way over-leveraged situations.  As each strategy is different, the results, in currency valuations, interest rate levels, and near-term growth, should be too. China is a different case. As it has aggressively used credit to generate growth, we might be worried about its over-leveraged position, but
the high level of economic expansion mitigates this issue dramatically especially when compared to the European periphery. However, as a Communist country that seems to be embracing its historical past more fervently, China is allowing its state-owned sector to borrow and expand without adding to profitable growth, and its new leaders might accelerate its economic decline.


Sunday, October 20, 2013

USD.JPY

Merkel with Clipped Wings 

By John R. Taylor, Jr.

The financial world seems totally nonplussed about the German election on Sunday.  We agree that Angela Merkel will be the Chancellor once again, but we aren’t so sure about her freedom of movement on Monday morning, especially in the areas we care about: German policy on the euro and the manner in which Germany interacts with the other countries of the Eurozone concerning financial and structural issues.  From our viewpoint, the crushing defeat of the Free Democrats (FDP) in Bavaria last weekend, where they polled only 3% – far below the 5% cut-off for parliamentary representation – was a bitter pill for Merkel, even though the CSU, the Bavarian branch of the CDU, polling over 47%, won a spectacular victory. Merkel is not running above 40% in the national polls and, even though that is not bad compared with the Social Democrats (SPD) around 26%, it will not put the CDU in power by itself.  There must be a coalition partner, and with the FDP failing – at least, that is our forecast – Merkel will have to turn to the SPD once again.  What makes this negative outcome more likely is the rapid growth of the country’s new euro-skeptic party, the Alternative for Germany party (AfD), which is taking votes from both the FDP and the CDU, weakening or dividing the right side of the political spectrum, just like the Left party has divided the left.  With six parties scrambling for representation, a coalition is always a common outcome, but this coming coalition will be different than the last. The SPD is not the FDP and Merkel will have a hard time getting her way when it comes to her policies toward the southern deficit-ridden and recession prone economies.  Even if the Socialist Party is made up of Germans, they are socialists and their voters are predominantly labor.

Their policies are more supportive of intervention and planning than Merkel’s, which has moved only when a crisis strikes.  The SPD backs the Redemption Pact, leading eventually to a pooling of European debts, which had many supporters in the first half of 2012, before Draghi pulled the bumblebee out of his hat. To us this means that there will be increasing tension within the coalition as the SPD sees the next crisis developing. The SPD will push policies that help the whole of Europe far harder than the CDU would.  What gives our picture of the future an exciting edge is its reality show overtone: Real Finance Ministers of Berlin. Remember that Peer Steinbrück was Merkel’s Finance Minister in the last grand coalition from 2005 to 2009 and that Wolfgang Schäuble is Merkel’s current Finance Minister.  Neither of these are shrinking violets, and Schäuble has said that he plans to keep his job after the election, but Steinbrück’s history and strength is in exactly the same area.  His stellar work strengthening German competitiveness fell into Schäuble’s lucky grasp. Steinbrück is not a raving socialist, as he is definitely on his party’s more conservative side, but he does see the need for education reform, infrastructure, and a strengthening of Eurozone and European coordination.  Merkel has always been passive and slow to react to coming problems outside of Germany, within Europe, and the SPD will not sit quietly by while things unravel.  Probably Steinbrück does not have the strength to win the battle against Merkel and Schäuble on his own, but it is extremely unlikely that his party will march meekly behind the CDU as the FDP has.  Don’t expect any immediate change in Germany’s approach to Europe, but you must expect fireworks as soon as the next crack appears.

Battle of the Central Banks 

By Jonathan Clark 

The economic policies of Prime Minister Shinzô Abe, collectively termed ‘Abenomics’, increased consumer optimism and paid early dividends in economic terms, but their impact is starting to fade.  After growing 1.0% in Q1 and 0.9% in Q2, forecasts call for Japanese GDP to slow during the second half of the year. Consumer confidence climbed from 39.9 in December of last year to 45.7 in May, before falling back to 43.0 in August.  Mr. Abe is expected to announce by October 2 that the sales tax will be allowed to increase from 5% currently to 8% next April, but he is also expected to announce a stimulus package to businesses and consumers to counteract the effects of higher taxes.  The major impact to growth of Abenomics appears to be behind us and that leaves the Bank of Japan to do the heavy lifting of stimulating the economy.  On April 4, Bank of Japan Governor Kuroda announced a massive quantitative and qualitative monetary easing program (QQE) to inject $1.4 trillion into the economy in less than two years.  The monetary base would nearly double to ¥270 trillion by the end of next year in a step intended to achieve the BoJ’s 2% inflation target.  The BoJ committed to buying ¥7.5 trillion of long-term government bonds per month, which is more than the Ministry of Finance is currently issuing, and should ensure that JGB yields remain relatively low.   
  
In the battle of central banks, the Federal Reserve hit the canvas on Wednesday when it failed to meet market expectations and taper asset purchases.  As the chart clearly shows, this caused US interest rates to fall versus those in Japan and as a result dollar/yen declined.  The BoJ won this round, but the fight is far from over as we expect US interest rates to rise versus Japanese interest rates over time and this will support the dollar/yen.  Except for during the three weeks following May 22 (the date that Fed Chairman Bernanke’s stated that the pace of bond purchases could be tapered within the next few meetings of  FOMC, provided the economic recovery continues), the widening short-term interest rate differential between the US and Japan has been positive for dollar/yen.  This recent setback is unlikely to persist for long, but it should take up to several weeks before dollar/yen resumes its major uptrend.  Our strategy is to buy dollar/yen on weakness.  According to the cycles, the most likely time for a low in USD/JPY is the week of September 30, but we are not expecting an aggressive decline and we doubt it will fall below 96.25 and it might not even prove that weak.  Following this low, dollar/yen should turn higher and resume its uptrend.  A close above the resistance at 100.10 will signal that the uptrend has resumed into early January and our target for this upmove will become the 106.00 area. 

EUR.USD

Happy for a While 

By John R. Taylor, Jr.

The first year of the American presidential term is almost always good for equities and 2013
looks as though it will add further weight to that rule.  Most often the second year looks worse than the first, both in a GDP growth sense and a market sense, and, once again, we find ourselves in agreement with this view.  Our cyclical analysis is somewhat more intricate, encompassing many more factors, but if the cycles around the US elections are true, they should correlate with our work, and they do.  At the beginning of this year, we were bullish in the first quarter, bearish as we approached the summer and then positive to year-end.  We did not get it as right as we would like, as the optimism and strength continued for several months more than we expected before any weakness was seen, and the strength has only recently begun to show through again.  It seems to us that we are running about six weeks slow and the global ‘risk-on’ feel should persist into the end of the year. As the long-term cycles see peaks in US interest rates, a peak in the euro, and peaks in most global equity markets, we seem to have significant coincident confirmation.  Some weaker markets, like those in emerging market currencies, their interest rates, and equity markets see the period between December 1 and the first few days of January as an intermediate high, to be followed by another half year of decline before a significant low is seen.  Most likely, the second year of Obama’s second term will prove quite unpleasant for those of us in the asset management business.

As the cycles signal a positive view, we have to conclude that the ‘tapering’ process has been overblown.  In fact, the shorter cycles do not call for a minor peak in risk assets until the end of the month. If there is any pause between now and then, it should be fairly insignificant, probably centered around the two days right before the Fed announcement. Obviously some of these feelings have to be nothing more than conjecture after listening to various Fed speakers and other pundits, but we think there are also some significant indications that lead us to conclude that the climb in interest rates and the Fed’s willingness to push them higher will not be as aggressive as the market has been thinking.  Although our cyclical picture for US rates calls for them to move higher, we do not see the belly of the curve moving much higher, but rather forming a group of tops as it often does at major turning points.  The TIPS market and other indicators imply that the rate of inflation in the US is declining not climbing, and moves towards deflation are not associated with climbing interest rates or a rising stock market.  Our view of the cycles in the ‘inflation-expectation’ market are quite similar to those in the emerging markets – that is, there will be a cyclical peak in expected inflation near the end of the year.  However, this peak should be unimpressive, compared to the major trend which is now down.  The Fed’s favorite measure of inflation, the core PCE, is around 1.20% – rallying from an originally-reported 1.05% two months earlier.  These are not numbers that imply sharply rising rates and they do not correlate well with rising stock prices either. Although we understand that Bernanke and many of his Fed supporters would like to close the curtain on their large-scale asset purchases (LSAP), this will eventually be seen as inappropriate, probably at just about the time that Bernanke is leaving office. 

Europe Long-Term View Pick Your Risk in Europe  

By Jonathan Clark 

For global sovereign debt investors, choices in the US are limited to Treasury securities and must one currency – the US dollar.  US debt is rated AAA by most rating agencies and is extremely liquid, which makes it safe and attractive.  For most of the past five years, the Federal Reserve has been buying Treasury securities, which adds to demand and lowers the risk of mark-to-market losses.  Most investment decisions in US sovereign debt tend to involve how far out the yield curve to invest (in other words, what duration to plough money into).  The US 10-year Treasury Notes currently have a yield of 2.95% – this is likely to go up as the Fed scales back its debt purchases, causing losses for holders of the debt.  Currently, the appetite for US Treasury debt is relatively low. 

But, when investing in the Eurozone, the choices are far more diverse, although the choices are denominated in a single currency as well – the euro.  There is a smorgasbord of sovereign bonds to buy with 10-years paying a low of 2.04% in Germany, sporting a rating of AAA, to a high of 10.00% in Greece, with a rating of B-.  Investors generally choose to invest somewhere between these two extremes.  Spain yields 4.48% and has a BBB rating; Ireland yields 3.96% and has a BBB+ rating; and a variety of other options exist as well.  The point is that just examining the short-term yield differential between Euribor and Eurodollars – which is typically used to evaluate the carry on EUR/USD – doesn’t accurately describe investment opportunities in Europe.  This leaves interesting choices for investors. When they contemplate buying the bonds of an emerging country like Hungary, rated BB, to earn 6.26%, along with this yield, they get saddled with owning the forint.  Why buy the currency risk? There are 12 Eurozone member countries that issue sufficiently liquid bonds that, as a group, yields an average of 3.93%, or a pick-up of nearly 1% over US debt.  The average credit rating is lower than the US, but with many emerging markets in crisis, the Eurozone appears to be an attractive bet – particularly since investors have a wide variety of risk and duration to choose from. This causes tremendous demand for euros. 
  
The cycles are positive on the single currency into very early October and this overall strength is likely to last into December.  The shorter cycles call for a minor peak on Friday and the euro should then pull back for a few days before the uptrend resumes.  The most likely time for a medium-term peak is the week of September 30.  Our initial target for this uptrend is the 1.3550 area.  Following this peak, EUR/USD should pull back for a week or two before the uptrend resumes.  The longer-term cycles call for a major peak in December.  Our conservative objective is the 1.3700 area.  Only a close below 1.3120 means that our positive outlook is wrong and it is headed directly lower into early November, but this is very unlikely. 
To contact FX CONCEPTS New York: 1 (212) 554-6830; London: +44 20 7213 9600; Singapore: (65) 67352898; research@fx-concepts.com P

Huey Lewis and the News!

by Jeffrey Saut

The object lesson here is an old one. Throughout the 80 year history of the Lowry Analysis, it has always been difficult for investors to produce consistent portfolio profits by trying to buy or sell stocks based on the news of the moment -- the same news every other investor knows. The better course of action for investors is to always stay focused on measurements of the forces of Supply and Demand, and to structure portfolios in accordance with the dominant trends of the market. Short term considerations – with our short term indicators at oversold levels, a buy-signal intended for aggressive traders was triggered on Thursday, Oct 10th, when the 14-day Stochastic rose back above its moving average. And, a conventional short term buy-signal was also registered on Thursday when the 90% Upside Day caused our Short Term Index to rise a total of 6 points from its recent low.
... Lowry’s Weekend report
Thirty years ago Huey Lewis and the News released their smash hit album titled Sports. It was an instant hit with every song on the album a winner. And last week Huey was playing on the Street of Dreams as participants danced to his hit tune “This Is It.” Of course, the “It” in question is a potential deal between the House of Representatives and the President on the debt ceiling and the government shutdown. Readers of these missives know this is what always happens with such stand-offs, which would be a deal arriving at the last minute, just like what occurred with the “fiscal cliff.” That sputnik moment fostered back-to-back 90% Upside Days, meaning 90% of total Upside/Downside points and volume traded on those days was recorded on the upside. Those two sessions were 12/31/12 and 1/2/13, and that same week I noted that since 1950 such back-to-back Upside Days have seen the S&P 500 (SPX/1703.20) better by 6.1% one month later (83% of the time) and up 12.8% higher three months later (100% of the time). This year we did not quite make the three-month 12.8% returns, but we certainly came close. Interestingly, one year later, back-to-back 90% Upside Days has seen the SPX up 18.9% nearly 100% of the time. Obviously, we will have to wait until January to see how that one plays, yet it is pretty interesting that is about how much the SPX is up year to date. I mention this 90% Upside Day indicator this morning because October 10th was the first 90% Upside Day since the beginning of the year, and while Friday failed to qualify as another 90% Upside Day, it clearly was a step in the right direction.
On last week’s 90% Upside Day, I received a number of emails and phone calls asking if short covering amplified Thursday’s Triumph of some 323 Dow points. I responded, “I am sure it added to the intensity of the rally.” Early the next morning I was talking to a portfolio manager in London who asked me if I had heard about a large prime brokerage firm being closed down by the U.K. regulators on October 14th. A prime broker, for those who are not stock market professionals, is defined by Wikipedia as:
Prime brokerage is the generic name for a bundled package of services offered by investment banking firms to hedge funds and other professional investors needing the ability to borrow securities and cash to be able to invest on a netted basis and achieve an absolute return. The prime broker provides a centralized securities clearing facility for the hedge fund so the hedge fund's collateral requirements are netted across all deals handled by the prime broker.
And in this case “the hedge fund’s collateral requirements” is the operative phrase because said closing prime broker was giving its clients 10-to-1 leverage. That would be for every $1,000,000 a hedge fund had they could buy (or short) $10,000,000 worth of stock. Accordingly, many hedge funds began scrambling last week to find another prime broker willing to give them 10-to-1 leverage. Since it is doubtful they will be able to secure such leverage again, those positions should have to be squared. If you are “short,” and using 10:1 leverage, that means you probably had to “buy in” most of those short positions. So yes, short-covering played a role in last Thursday’s romp.
Comes Friday, and the equity markets really needed to build on Thursday’s rally, and after a shaky start stocks did just that. However, at 20% the Buying Pressure Index was a mere shadow of Thursday’s +93% reading. Nevertheless, a short-term “buy signal” was triggered when the 14-day Stochastic traveled above its moving average and the short-term trading index rose 6 points. Last week also saw my proprietary trading index touch an extreme downside band at 1646, where it was red in color, and then turned green at the extreme upside trading band of 1704. For such an event to occur, within a single week, is a pretty rare event. Also rare was this insight from Jason Goepfert’s invaluable SentimenTrader organization:
There have been 7 other times in the history of the S&P 500 tracking fund, SPY, that it hit a multi-week low, then gapped up the next morning at least 1%, then followed through with those gains the next day (when above the 200-day moving average). Each of them led to further gains in the next three weeks, averaging +3.5%, though the risk/reward was less positively skewed than ideal, as conditions were sometimes volatile.
So the upside should be favored here, although it should be favored with a cautionary tone because of the day-over-day drop-off in the Buying Pressure Index.
As for stocks for your potential buy list, these are favorably rated by our fundamental analysts and screen well by my proprietary indicators: Apache (APA/$87.95/ Outperform); Aflac (AFL/$64.48/Outperform); National Oilwell (NOV/$79.32/Outperform); NVIDIA (NVDA/$15.26/Strong Buy); and Jabil Circuit (JBL/$21.99/Strong Buy).
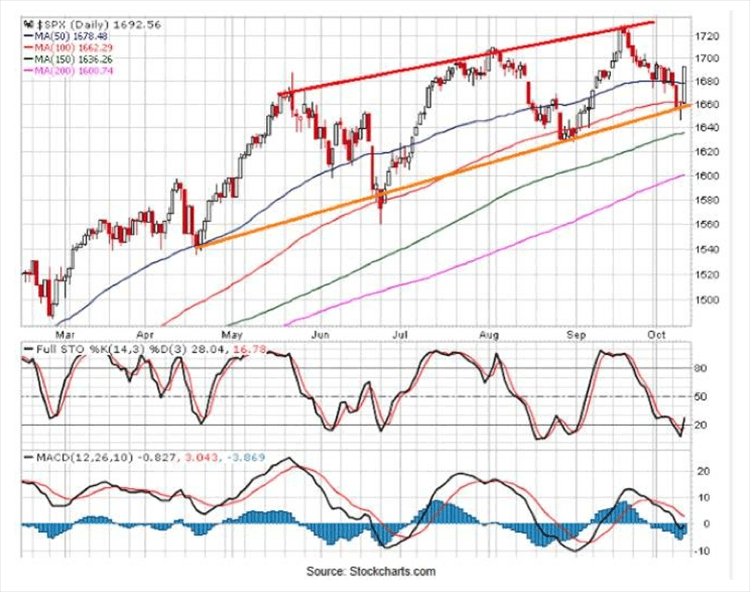
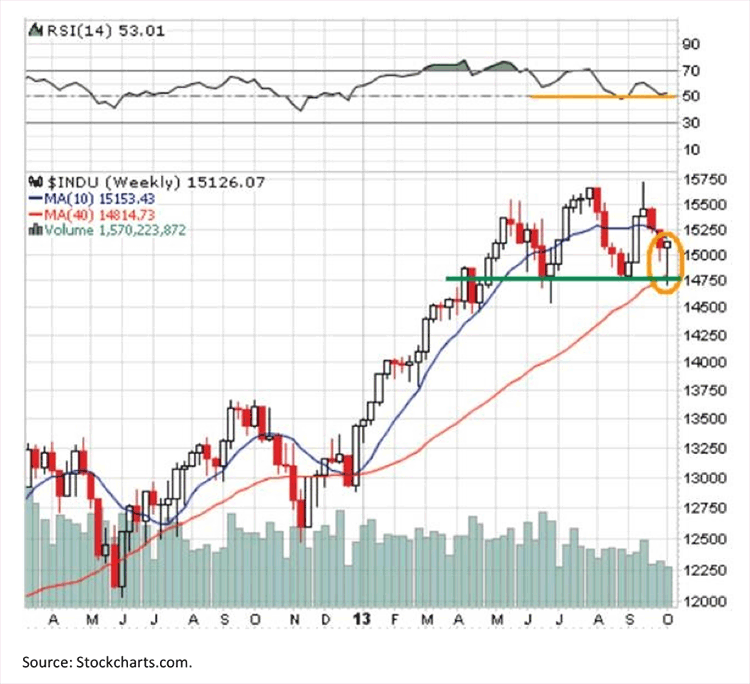
The call for this week: Having lived inside the D.C. Beltway, I know how the Washington Waltz plays and therefore have been adamant about a deal being in the works. Indeed, over the past two weeks I have spent time inside the Beltway and my conclusion remains the same. Plainly, I do not think it is different this time, and neither does the stock market; a deal will be done. Last week the Dow Industrials halted their decline around the 100-day moving average (1662) on a closing basis, a feat that has been repeated numerous times over the past few years. Interestingly, on their upside reversal day (last Wednesday) the Dow Industrial formed a bullish “hammer” pattern in the candlestick charts (see the orange circle in the attendant chart). As it did last year, and again this year, the 100-DMA has tended to contain any decline. This morning, however, the “now you see it, now you don’t” debt ceiling deal is in “now you don’t” mode, leaving the preopening SPX futures down 12 points, which brings back into play my often mentioned 1684 “pivot point.” Obviously, what happens inside the Beltway this week will determine the near-term direction for the stock market. I continue to believe a deal will evolve and the equity markets will then focus on the good things that are happening.

Ashes to Ashes

by Jeffrey Saut

The phrase “ashes to ashes, dust to dust” is derived from the Biblical text ofGenesis 3:19 and was adapted to its present form at an old English burial service. Last week I repeated those words as I scattered my father’s ashes next to my mother’s in the memorial garden of the church they loved so much in Richmond, Virginia. Indeed, my week was spent in Richmond, Washington D.C., and Baltimore seeing institutional accounts, consulting with political types, and speaking at various events for our financial advisors and their clients. Other than my dad’s service, the highlight of the week was D.C. because of the drama currently playing inside the Beltway. I think the “budget” charade ends this coming weekend for the reasons stated in last Monday’s missive. To wit, politics is all about political interests and survival. To that point, the President is not up for election ever again, the Senators and Congress folks are. It’s pretty easy to figure out who wins that game of chicken. Moreover, the budget deficit is collapsing at a much faster rate than even the non-partisan CBO suggested. That reduces support for tax increases and spending cuts. More importantly, the Republicans have ceased bargaining their budgetary votes away in exchange for tax and spending cuts. Their “cry” now is to repeal/defund Obamacare, which I have repeatedly stated is a flawed strategy. While one can argue it is the principal of the thing, in the real world Obamacare is here to stay, although it could be tweaked to be more practical. As one governmental insider told me (as paraphrased):
The proof of whether Obamacare is going to work will be seen over the next three months. How many uninsured will sign up? My guess is that half, at the most, will sign up even though the legislation was clearly designed to benefit them with federal subsidies to make insurance affordable for them. I will bet three-fourths of the uninsured don't even understand the details. What will the Obamacare advocates say when only one third of the uninsured sign up? The goal was to make available health insurance for all Americans, but what happens when the uninsured don't play ball? Even young, healthy Americans might defer buying insurance because they are in a mental-complacency rut and have other interests for the way they spend their money. We could learn from other societies; Singapore, which is one of the most dynamic business communities in the world, requires all workers to have their own personal health care fund, and each person must contribute to it each month. QED ...
This week I will be in Boca Raton speaking at a national conference and seeing accounts, followed by a speaking tour in Michigan. Interestingly, individual investors want to know what the professional money managers I have been seeing are doing, while the money managers want to know what individual investors are doing. In regards to the latter question, individual investors seem to be “frozen” like deer in the headlights, believing that you need to have a feel good environment to have a secular bull market. The reality of the matter is that when you finally get that “feel good” environment, it tends to be pretty late in the overall scheme of things. To be sure, it was very easy to buy tech stocks in 1999, but that proved to be a flawed strategy. Over the past few years it has been pretty easy to buy “bonds,” but that too has proven to be a flawed strategy since the bond bull market appears to have ended. Manifestly, I think you should be very careful with the fixed income allocation of your portfolio at this point. Indeed, since July of last year interest rates have doubled, with a concurrent decline in most bond funds. As a sidebar, bond funds are not fixed income since bond funds have no maturity date. If you disagree, just look at how most bond funds have performed over the last few months. The exception has been the only bond fund that I currently own, and have recommended numerous times in these missives, namely the Putnam Diversified Income Trust (PDINX/$7.78). I still advise you to consider PDINX for the fixed income allocation of your portfolio.
As for the equity markets, I think the budgetary charade ends this coming weekend. To me, the only question is if we get a post-weekend stock market “let down,” since Friday’s Fling (+76.10 points) seemed to be all about hopes for a budgetary agreement over the weekend. Interestingly, while the D-J Industrial Average (INDU/15072.58) and the S&P 500 (SPX/1690.50) were both lower last week, the small and mid-cap indices were virtually unchanged. Indeed, of all the indices I monitor only those two, and the D-J Utility Index, were down for the week. This suggests the equity markets’ primary trend remains “up.” This view is also confirmed by the Advance/Decline figures, as well as the Buying Power/Selling Pressure indicators. Surprisingly, the NASDAQ Computer Index, and the NASDAQ Financial Index, resisted the decline of the past week, which potentially means those two sectors could assume more leadership when the overall stock market regains its footing. To the relative strength point, the S&P 400 MidCap Index and the S&P 600 SmallCap made new bull market highs last week, which is certainly good for Raymond James’ universe of research names. As for the S&P 500’s 10 macro sectors, only Consumer Discretionary (+0.21%), Healthcare (+0.94%), and Materials (+0.84) were positive for the week. I find that sector performance insightful because two of those sectors are economically sensitive, implying the economy should strengthen into 2014.
As for the negative article in last Friday’s Wall Street Journal titled, “Companies Rush to Lower Earnings Bar,” which so many clients have emailed me about, I would not put much emphasis on the cautionary tone U.S. companies are sounding about third quarter earnings. The article notes that there have been 89 negative preannouncements so far and only 19 positive ones for the S&P 500 companies. The Journal says, “That makes for a record-high ratio of 4.7 times.” The article continues by stating:
“The ratio was even more skewed last quarter for the 111 companies that bothered to issue some type of explicit guidance, according to FactSet. Of those, 86% exceeded the number or range they had given themselves, while only 9% lagged behind. ... [Therefore] negative guidance on its own probably isn’t a worry for the market overall.”
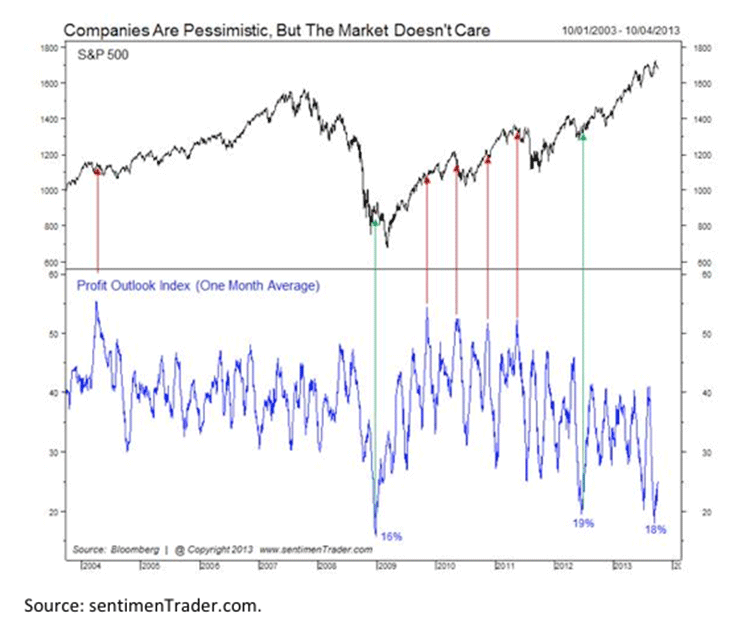
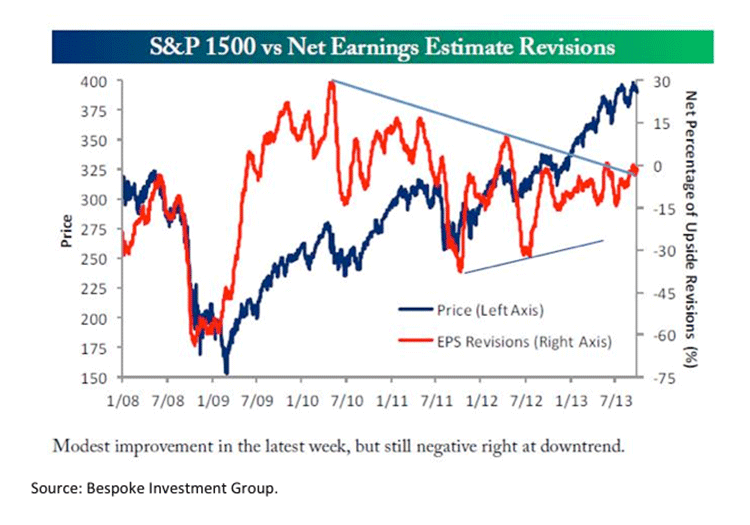
Not a worry indeed, because history shows such guidance is more of a contrary indicator. While it is not exactly the data set the Journal used, the chart on page 3 demonstrates the validity of this data set as a contrary indicator.
The call for this week: I think the budget conflagration turns into “ashes to ashes, dust to dust” by this time next week, allowing the equity markets to refocus on some of the good things that are occurring. Last week the SPX rallied back toward its overhead resistance at 1695 – 1710 and stalled with Friday’s lift, caused by hopes for a budgetary deal over the weekend. With no deal, we should see another pullback toward my often mentioned 1684 “pivot point;” and, isn’t it amazing how that level has acted as an attractor/repeller so many times. This morning our leaders remain intransigent on a budgetary compromise. That news, along with the World Bank’s lowering of the expected growth rate for China, has the preopening SPX futures off 16 points. As I wrote in last week’s Morning Tack, “1684 or fight!”

Characte

by Jeffrey Saut

“The true prophet is not he who predicts the future, but he who reads history and reveals the present.”
... Eric Hoffer, American moral and social philosopher
I could almost hear my history teacher espousing Eric Hoffer’s words last week as I was asked by a particularly prescient media type if trust and character would really command a “premium” price/earnings multiple for the stock market? My response was “of course,” and as an example I referred him to a quote from John Pierpont Morgan, who built his family’s fortunes into a colossal financial empire. The referenced verbal exchange took place when an aging J.P. Morgan testified before a House of Representatives’ committee investigating the financial interests of the “House of Morgan.” A tough lawyer named Samuel Untermyer queried him. The conversation went like this:
Untermyer: “Is not commercial credit based primarily upon money or property?”
Morgan: “No sir, the first thing is character.”
Untermyer: “Before money or property?”
Morgan: “Before money or property or anything else. Money cannot buy it ... because a man I do not trust could not get money from me on all the bonds in Christendom.”
While Morgan’s language is from an era gone by, the essential insight is as clear today as it was decades ago. I recalled the Morgan/Untermyer exchange as I read Friday’s Wall Street Journal, in particular, “Robbery at J.P Morgan.” The article began, “Government lawyers are backing up the truck again at J.P Morgan Chase (JPM/$52.24/Strong Buy) to extract another haul from the country’s largest bank.” Recall that JPM is one bank that did not need taxpayer assistance during the financial fiasco of 2008, or ever since. To me that speaks volumes about the character of JPM’s CEO, Jamie Dimon. This lack of government dependence, combined with Mr. Dimon’s remarks about how the Dodd-Frank financial reform act is hurting the economy, is likely what put Mr. Dimon in the government’s crosshairs. This also explains why the government is beating up on JPM again over the “London Whale’s” $6 billion trading loss, even though there were NO public costs. The irony is that Jamie Dimon is one of the few bank CEOs who avoided the credit excesses. He also, at the pleading of the government, rescued Bear Stearns and Washington Mutual (WaMu). Then-FDIC Chairperson Shelia Bair said, “[The WaMu situation] could have posed significant challenges without a ready buyer. ... Some are coming to Washington for help; others are coming to Washington to help.” Now it appears Washington is suing JPM for helping. I have no doubt about Jamie Dimon’s character. I do, however, doubt the character of some of the folks inside the D.C. Beltway, on both sides of the political equation, who are about to close down the government.
As of this writing, it looks like a governmental shutdown is a fait accompli. But having lived in D.C., many times these things are over-dramatized. Tonight marks the end of the U.S. fiscal year and without an agreement on a “continuing resolution” (CR) the government will indeed shut down at midnight. Following that comes the much more important “debt ceiling” debate to prevent a U.S. Treasury default on October 17th. Since 1970 there have been 17 “shutdowns,” and guess what, we have survived every single one of them. Interestingly, the stock market has historically done worse the day and week after the shutdown than it did leading up to the event. Moreover, in 11 of those 17 instances the S&P 500 (SPX/1691.75) was higher one month later. Like I did with all the “tapering” noise, I tuned out the noise (hints, leaks, etc.) and paid attention to the data, not the rumors; I am doing the same thing here. That “tuning out the noise” was why I was adamant there would be no tapering at the September FOMC meeting. I think the same holds true with this “shutdown” and/or “default” situation. The way Washington works is all about political interest and political survival. As Senator John McCain told the New York Timeslast week, “We will end up not shutting down the government, not defaulting and not defunding Obamacare. I’ve seen how this movie ends, but I don’t know all the scenes.” Speaking to this “political interests/survival” issue, the President is not up for election again, the Senators and Congress folks are. It’s pretty easy to figure out who wins that game of chicken. Moreover, the budget deficit is collapsing at a much faster rate than even the non-partisan CBO suggests. That trend reduces support for tax increases and spending cuts. As the astute GaveKal organization notes:
The big spending reductions implemented since the 2011 budget crisis have left little scope for further significant reductions in discretionary spending. Fiscal conservatives now recognize that the only programs large enough to transform the budgetary outlook are Social Security, Medicare and defense – but these programs tend to be strongly supported by elderly and conservative voters. That, in turn, implies a political transformation. The Republicans are no longer trying to extract major spending reductions in exchange for their budgetary votes. ... Republicans are now using budget votes to advance a political cause, the abolition of Obamacare, which is purely symbolic because it offers no scope of compromise with the President and therefore no chance of enactment.
Understanding these points makes the upcoming battle predictable. Rather than destroy our country’s credit with a default, and a long-term closing of the government, this charade will be resolved over the next few weeks. The Republicans, rather than be blamed for the whole thing, will “cave” and the shutdown/debt ceiling issues will be resolved just like what happened with the “fiscal cliff,” which at the time I said was also a non-event. While this is not as much of a non-event, we will get through this, just like we got through what the media termed the fiscal cliff “Armageddon.” When we do, the equity markets may do what they did following the drama of the alleged fiscal cliff “crisis”; the SPX rallied 100 points before experiencing a decent pullback.
The call for this week: I am in the Washington D.C. area consulting with political types, seeing accounts, and speaking at events for our financial advisors. I began this commentary with the quote, “The true prophet is not he who predicts the future, but he who reads history and reveals the present.” If you study the history of governmental shutdowns, there have been 17 of them since 1970 (see chart on page 3), and it becomes clear the shutdown and potential default will get settled over the next few weeks. If so, the stock market’s attention should revert to the improving economy, gasoline prices at their lowest level since January, improving earnings, better economic numbers out of China, well you get the idea. Interestingly, it has been the mega cap stocks that have been the weakest, which is why the D-J Industrials (INDU/15258.24) has been weaker than most of the other major indices. I still think the near-term directional battle will be fought at my longstanding 1684 “pivot point” basis the SPX. This week should provide the answer. One of the good things about the recent decline is that you get to see which sectors are holding up the best. Based on my methodology, Financials, Industrials, Consumer/NONCYC, and Consumer/CYCLIC are currently the strongest sectors. This morning, however, it looks like the opening prices are going to slice right through my 1684 “pivot point.” But, it is the closing price that counts. Fortunately, you should still have a decent cash reserve since I recommended only recommitting a little of our cash three weeks ago.

Thursday, September 5, 2013

USD.CAD

Statistics and a Centrally Planned Economy

By John R. Taylor, Jr.

Living in the country with the most fabulously disorganized government in the world, with three famous branches and dozens of others which are hard to remember – all of which are attempting to expand their power and their budget by putting their best face forward – we hear a cacophony of information. These many facets of the government power structure deliver statistics to the rest of us and, very often, their views are different, reported with a different angle because they are beholden to different political ideals or different lobbying groups. Added to these official statistics are those of diverse unofficial sources – the Conference Board, Markit, or Bloomberg – who slice and dice reality in their own ways. The competition among data sources means that errors are not tolerated, data can be trusted, and the detail is impressive. As a result, analysts not only have a wealth of data to review, but they explicitly believe it. This plethora of information and the trust surrounding it are all a function of the decentralized nature of the US system. Everybody is checking on everybody else, and no one is boss. We would propose a rule: The quality of data is positively correlated with the decentralization of the control system. If we examine the historical record involving large American, European, and Japanese companies, which, of course, have much more centralized control than the US government, we soon see that the statistics they report about themselves are less trustworthy. In some cases, the deceptive numbers are so pervasive that the companies fail once the real numbers rear their ugly heads. Olympus, Enron, and Washington Mutual come to mind, and the results involved losses of millions of dollars and many, many lawsuits. The centralized nature of business organizations is the reason we have audits, the SEC, and the FDIC. The truth is positively related to competition.

As competition is a critical component of high-quality statistics, we should always take the numbers put forward by command organizations with a large dose of skepticism. Forty years ago, if you were a middle manager in a corporate behemoth like IBM, you were given sales targets, profit targets, and expense targets that you were expected to meet or exceed. Failure was harmful both for your current pay and your future career. As a result, you would do everything possible to fulfill as many of your goals as possible, even if it meant hurting the company in the longer term or twisting the truth a bit. The penalties were not life or death, however, as this was America, and there was another job somewhere else that involved a different power structure – a different ladder to the top. Transfer this IBM example to a system where all the power structures were tightly interrelated, and there really was only one ladder to take. A centralized economic and social system, unified around a political party that involves itself in every step of the economy has much more power than your boss at IBM could ever have had, as there is no GE or Dupont down the street. When the Central Committee says that growth will be around 7.5% in the next year, that order flows down through the entire system, telling every manager in the State Owned Enterprises (SOEs), which dominate the economy, what part they are to play in making that goal. When the local collector of statistical information calls up, and things aren’t going too well, what are they going to say? The odds are each one will be more positive than is warranted. Multiplied millions of times throughout the system, reality is distorted. There is no way that it cannot be. Because of this, China watchers distrust almost all statistics and believe only those that avoid centralized collection methods or ones that are outside of the country. Electricity usage was one of those but, as it becomes popular as an indicator, it threatens to fall increasingly under centralized management and will lose its validity. Recently the official PMI numbers, which have shown inconsistencies in the past, were partly withdrawn from the market as they could not be verified with other sources of data. Although the numbers are looking good today, it is hard to know whether China is actually growing at the rate claimed by the statistics.


Tarred with the Same Brush 

By Jonathan Clark

The Canadian dollar has been in a downtrend for nearly a year and it is unlikely it is over yet. Perhaps the most remarkable aspect of the currency is that the normal quantitative relationships have broken down and are showing no signs of reasserting themselves. The most important variable in the value of a currency is capital flows, which are largely influenced by short-term interest rate differentials. This has been a non-factor due to the directionless nature of interest rates in the US versus Canada (green line). At his first meeting the new Bank of Canada, Governor Stephen Poloz tied future hikes in official interest rates (currently at 1%) to economic growth, but without specific targets. The Canadian economy is growing, but at a slower annual pace than the US. Inflation at 1.3% in July is well within the 1-3% BoC target band. Canada is a major exporter of energy but, despite higher oil prices since the middle April, the Canadian dollar is lower since that time. The prospects of a US strike on Syria could cause a spike higher in the CAD due to the normally positive correlation with the price of oil, but it appears unlikely that the impact would last in the current environment. When considering all of the commodities Canada exports on a weighted basis, the value is roughly unchanged from the start of the year. The currency tends to trade with an equity index like the S&P 500, and yet thus far this year the correlation is -79%. Canada is mainly
suffering because of the end of the mining boom and the slowing of capital into this industry. The CAD hasn’t suffered nearly as much as AUD, BRL or ZAR, but it is being tarred with the same brush and this is keeping it under pressure.

USD/CAD should weaken into Friday when a minor low is due and should test the support at 1.0450. It should then recover for a few days before making a further decline into the week of September 23 when a medium-term low is due. Our target for this downmove is the 1.0375 area. Although there is a chance it could fall to as low as 1.0260 before bottoming, this negative outlook is far less likely. Following this low expected in late September, USD/CAD should turn higher and rally into late October when a significant peak is due. If the resistance at 1.0550 breaks at any time then it can trade to as high as the 1.0875 area before peaking, but this is becoming less likely and we expect a continuation of the slow and steady upmove. It now appears that any final strength seen in late October will be modest and then dollar/Canada will turn lower and decline for a minimum of several months.


Wednesday, September 4, 2013

Money and Savings?

by Jeffrey Saut

“It so happens that I spend a fair amount of time thinking and reading and teaching and writing about money. I talk about savers getting ripped off, about trustees who can’t be trusted, about accountants from whom you simply cannot ever get a straight count, and about geniuses like Warren Buffett who make their investors rich. Money is a vital life enhancer. If you have it, you can enjoy life incomparably more than if you don’t. The great storehouses of travel, leisure, rest, refinement, appearance, health, above all, peace of mind – all of these are open to you if you have money. It doesn’t have to be millions, or even hundreds of thousands. But it has to be enough so that you can know from one hour to the next that you are not going to be starved, dunned by your creditors, thrown out of your apartment, put on the street, or made to fear becoming homeless. (All this) has made me consider once again my parents and how very different their lives are. My parents, who are not really rich, have never, as adults, as far as I can recall, been seriously worried about money. There is a simple reason for that; they have always lived modestly, even frugally, and have always had wants that are modest compared with their means. They are not geniuses at investing and have never been wildly well paid. They have just been like the ant. Laying aside money year in and year out, and now they have a comfy cushion around them. Their friends and colleagues of their age all seem to be similarly situated. What I keep coming back to is that the real bottom line is a simple idea that the savers know and the terrorized don’t: Money is not for spending. Money is first for saving, and then for spending.
Or, you might put it a different way. Money is for spending on a rainy day. If that rainy day doesn’t come in your life, it might come in your children’s. Money is protection, the shield and the buckler for your family and for you. There is no new suit of clothes, no vacation, and no new car that can offset the pain of being truly worried about running out of money. I have had that fear. It comes at about five in the morning, and it keeps you awake and makes your mouth dry and makes you hate the sound of the birds singing in the morning. It’s probably not realistic in my case, but I don’t want anyone I love to come even close to it.”
... The American Spectator, by Benjamin J. Stein (March 1995)
I spoke to Ben Stein (American actor, writer, lawyer, and commentator on political and economic issues) a few weeks ago, and his parents sound a lot like my grandparents. My grandparents, and their peers, were just starting out in life during the depression. After experiencing those horrible economic times, saving for a rainy day became second nature. Their first worry was their job; then to put money away to buy a home and educate their children. Stocks never even entered their mind after the 1929 “crash” and the 1930 Depression years. Financial survival for them was the order of the day. They did without things to ensure they would never have to suffer economic hardships again. And most of all, they wanted to make certain their children wouldn’t either. There has been nothing like the 1929 crash, and the ensuing Depression years, since then; although for my generation the late-2007 through mid-2009 experience came close when the Dow Dive lopped an eye-popping 54.4% from the D-J Industrial Average (INDU/14810.31).
“Money is not for spending. Money is first for saving and then for spending.” What an interesting and important concept. Regrettably, subsequent generations to my grandparents mostly don’t believe it. Well, that’s not entirely true. The Baby Boomers (1946 – 1964), many of whom watched their stock market net-worth decline by more than 50% in the October 2007 to March 2009 debacle have hence learned the importance of savings. But, few of the Generation X (1965 – 1979), Gen Y’ers (1980 – 2000), or Gen Z’ers (2001 – present) have learned that lesson. To be sure, what determines your stock market performance (aka, savings) is not how you manage your winners, but how you manage your losers; how to avoid the big loss! And, in learning how not to lose money you have to evaluate risk, as well as how to manage that risk.
While I too believe that nobody can consistently “time” the markets, I also think if you listen to the message of the markets you can determine if you should have an aggressive investment strategy, or a not so aggressive strategy. To this risk management point, consider this. If in October 2007 you owned a $100,000 S&P 500 Index Fund, and were “in it for the long term” knowing it was a “plan” and not a short-term scheme, by the ultimate lows of March 2009 you had lost 57.7% of your money. If you continued to stick with that position until last Friday, you have made a grand total capital gain over that nearly six-year holding period of only 0.057% (excluding dividends). However, if you heeded the Dow Theory “sell signal” of November 2007 and decided to hedge your $100,000 “long” S&P 500 Index (SPX/1632.97) position using any number of suitable instruments, the combined portfolio may have posted a much more worthy gain over the October 2007 to March 2009 timeframe. The point is that you don’t have to constantly buy this, or sell that, but rather that the concept of managing risk is the central theme in attaining your long-term saving’s goals.
Over the past few months that is what I have been attempting to do (manage the risk), albeit with limited success, at least so far. I had targeted the mid-July through mid-August timeframe as the first window of the year for a meaningful decline to begin. I also noted that the timing models suggested the stock market’s internal energy would be totally used up on the exact date of July 19th; so that if you wanted a D-day, July 19th was it. And quite frankly, even though we did see a few “print highs” above the July 19th closing price of 1692.09, they were only marginally higher “closes” with most investors not making much money since mid-July. More importantly, the SPX is down about 4.5% from its August 2nd high and many stocks are down more than that. By my work, the SPX remains in a corrective mode, although we should get another rally attempt on the administration’s “no Syria” attack over the weekend. Unfortunately, I don’t think the correction is over. While it is true nobody knows when the ongoing pullback will end, or how deep it will be, my suspicion remains it will be below 1600 and above 1500 before it is over.
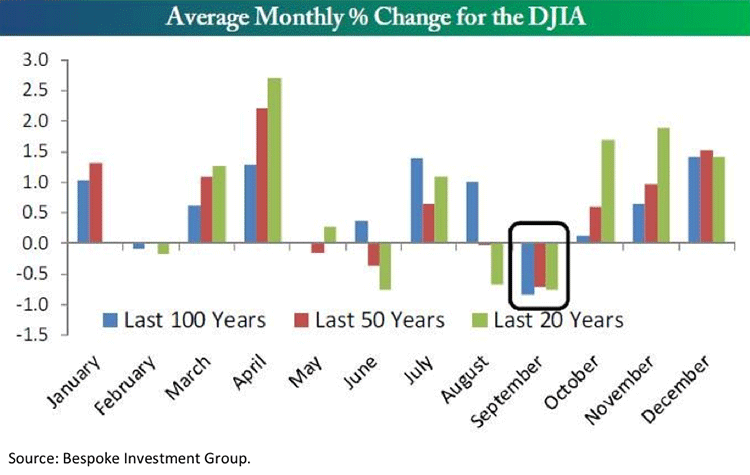
The call for this week: Mark Twain once said, “October: this is one of the peculiarly dangerous months to speculate in stocks. The other are July, January, September, April, November, May, March, June, December, August, and February.” And while it’s true, October is viewed by many as the most dangerous month due to the various stock market crashes associated with it, September is truly the worst month historically. Indeed, September has seen the worst average returns for the D-J Industrials over the past 50 and 100 years. The average monthly loss during the last 20 years has been 0.75% (see chart on page 3). That said, the stock market is again short-term oversold and registered a 90% Downside Day last week (8/27) whereby 90% of total trading volume came in on the downside. Such Downside Days tend to be followed by two- to seven-session rally attempts. The no missile strike over the weekend should provide the causa proxima for such a rally, but I doubt it can sustain much above my long standing 1684 “pivot point.”
P.S. – I hosted a conference call last week with my friend, and keen-sighted growth stock portfolio manager of the Lord Abbett Growth Leaders Fund (LGLAX/$19.57), Tom O’Halloran. Tom mentioned a number of stocks during that “call,” some of which are followed by Raymond James’ research department, and some of which are not. I looked at all those companies’ fundamentals and suggest you do the same. The playback number for that conference call number is (855) 859-2056 and the password is 29473014.

Tuesday, August 27, 2013

Random Thoughts in the Summer Doldrums

by Jeffrey Saut

On October 10, 2008, with the S&P 500 (SPX/1663.50) at 839.80, the bottoming process began when 92.6% of all stocks traded on the NYSE made new annual lows. That’s a six standard deviation event, which is supposed to occur only twice in a lifetime. At the time many investors were liquidating their portfolios because they did not heed Benjamin Graham’s advice in his epic book The Intelligent Investor, “The essence of investment management is the management of RISKS, not the management of RETURNS. Well-managed portfolios start with this precept.” Consequently, investors who failed to respect the Dow Theory “sell signal” of November 2007 ended up incurring substantial losses into the beginning of the October 2008 bottoming process. Moreover, they continued to liquidate their portfolios right into the S&P 500’s (SPX/1663.50) ultimate intraday bottom of 666.79 on Friday 3/6/09. Surprisingly, I was on Bloomberg TV that Monday (3/2/09) stating, “The bottoming process that began last October is complete this week and we are ‘all in’.” I have been pretty constructive on equities ever since.
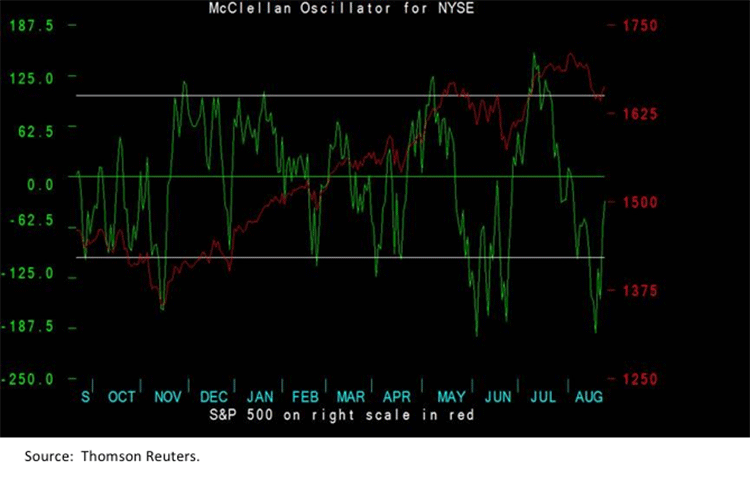
I did, however, recommend raising cash in the spring of 2010, 2011, and 2012, on a tactical trading basis, with the strategy of putting that cash back to work during the summer months; and, that is all you had to get right in those years to produce decent equity returns. This year my mantra has been that “Sell in May and go away” is not going to work as I targeted the mid-July through mid-August timeframe as the first window for a meaningful decline to begin. To be precise, it was the timing/quantitative models (not me) that gave the exact date of 7/19/13 for the stock market’s internal energy to be totally exhausted. Yet, I have been the one taking the heat for that “call” because the SPX made a few marginal closing highs above the July 19th high of 1692. Nevertheless, the fact of the matter is that the stock market’s internal energy was indeed used-up in mid-July with the various averages virtually going sideways and then pulling back 4.1% over the past three weeks (intraday high to intraday low). Interestingly, this recent pullback is remarkably similar to the May 22nd to June 6th decline of this year (see chart on page 3). That initial decline was roughly 5% and left the NYSE McClellan Oscillator extremely oversold. The SPX subsequently rallied 3.5% into its June 18th peak before resuming the decline into its June 24th low. The entire pullback encompassed 7.5%. If that chart pattern repeats this time it suggests the rally attempt that began last Thursday should peak between 1684 and 1696. Personally, I don’t think the SPX has the energy to make it back through my 1684 “pivot point.” On the downside, I still think the SPX has an appointment into the 1530 (April low) to 1560 (June low) zone.
Of course, I continue to think such pullbacks are within the context of a bull market since my confidence remains high that we are in a new secular bull market. Last week I carried that message to Nashville where I spoke with institutional accounts and presented at events for our financial advisors and their clients. Regrettably, most of them think you need a “feel good” environment for a bull market to exist. But, when you get that “feel good” environment it tends to be late in the game. Ladies and gentlemen, the equity markets do not care about the absolutes of good and bad, they only care about if things are getting better or worse. And, things are definitely getting better! To emphasize that point, in my presentations I always discussed the American Industrial Renaissance (onshoring) whereby manufacturing jobs are coming back to America. To wit, chemical companies are expanding into the U.S. because of our low natural gas prices. Airbus just broke ground for a massive new plant in Mobile, Alabama, VW is expanding its facility in Tennessee, Samsung is spending $4 billion in Austin, Texas, Michelin is investing $750 million in South Carolina, Denso is spending $750 million in five different states, and the list goes on.
Next is the energy independence theme, with the U.S. becoming the largest natural gas producer in the world in 2015 and likely going to be energy independent in the 2020 – 2025 timeframe. Yet most importantly, I think the 2010 mid-term election marked a turning point in the political arena whereby over the next five years we are going to elect smarter policymakers and therefore get smarter policies. Unsurprisingly, for that view I have been termed naive. In my presentations, I talk about numerous reasons for that belief. Unfortunately, there is not enough space in this missive to go into much detail on this theme. I will, however, offer some quips from last Thursday’s Wall Street Journal (WSJ) article titled “A New Law to Liberate American Business” by Thomas G. Stemberg, founder of Staples Inc., as an example of “smarter policies.” The author begins by noting:
“There are so many government impediments to business today that the next Staples—and its 50,000 jobs—might never get off the ground. Chief among those roadblocks: the blizzard of bureaucratic red tape that buries businesses and stifles job creation. These include the additional 16 million hours that vending-machine and chain-restaurant business owners must spend complying with new food regulations each year. But there is also the license that magicians require to do a rabbit disappearing act, which mandates an annual fee, surprise inspections and a rabbit disaster plan. All told, American business faces 46,758 pages of rules to live by in the Federal Register. . . . [Job] creators know that regulatory relief can't come soon enough. In 2010, the Small Business Administration pegged the annual cost of complying with regulations at $1.75 trillion. The SBA report covered 2008 and the burden has certainly grown since. A May 2013 report by the Heritage Foundation, "Red Tape Rising," found that new regulatory costs added in 2012 totaled $23.5 billion.”
Wow, no wonder job creation has been slow to recover. But, help may be on the way because of Senators Angus King and Roy Blunt. Their bill, “The Regulator Improvement Act of 2010,” would create a bipartisan Regulatory Improvement Commission whose purpose is to recommend cuts in the regulatory regime. Those recommended cuts would require a mandatory up-or-down, nonamendable, vote by Congress. The King-Blunt concept has already worked as seen with “The Defense Base Realignment and Closure Commission” (BRAC), which has been responsible for the closure of 121 major military bases since 1988. As the WSJ article states:
“In short, the BRAC Commission gave politicians what they crave most: cover. Nobody back home could blame them for losing a military base. The King-Blunt proposal will give representatives the same cover with regulations. The bipartisan Regulatory Improvement Commission – with members appointed by the president and congressional leaders – would tackle one area of regulation at a time. Its members would be charged with finding regulations that are duplicative, like the 642 million hours employees will spend complying with redundant regulations this year, according to the American Action network. The panel also will try to identify obsolete regulations, maybe resembling the arcane rules the Federal Communications Commission leverages to achieve whatever regulatory aims the commissioners desire.”
I happen to believe all of this is pretty bullish over the longer-term. But, in the near-term, I remain cautious for all of the stated reasons.
The call for this week: The initial leg down from the May 22nd peak ended on June 6th, which left the McClellan Oscillator very oversold (see chart on page 3). This decline has been followed by an ensuing 3.5% rally into the August 2nd top of 1709.67. Back in June, the secondary decline began on June 16th and ended on June 24th, taking another 94 points off of the SPX. The current chart pattern looks very similar to that of the May 22nd to June 6th drop, and if that pattern repeats, it suggests the current rally attempt should peter out in the 1684 to 1696 zone, followed by a secondary decline that carries the SPX into the prescribed 1530 – 1560 zone where a trading bottom should be anticipated. As a sidebar, I am hosting a conference call (call 1-877-601-1467 and ask for the Lord Abbett conference) this Thursday at 4:15 p.m. with one of the best stock pickers I know. He is Tom O’Halloran, the portfolio manager of the Lord Abbett Growth Leaders Fund (LGLAX/$19.83). He will be talking about the “six rivers of growth” in a slow growth economy, those being: the ongoing digitization of society; the dynamics of mass consumerism; the growth of emerging nations; the innovation of modern medicine; the American manufacturing renaissance; and the North American energy revival. Tom will also talk about individual stock ideas. I suggest you listen to this important call.

Sunday, August 18, 2013

Dog Days!

by Jeffrey Saut

The phrase “Dog Days” refers to the sultry days of summer. In the Northern Hemisphere, the Dog Days of summer are most commonly experienced in the months of July and August, which typically experience the warmest summer temperatures of the year. In the Southern Hemispheres, they tend to occur in January and February, in the midst of the austral summer. “Dog Days” is also defined as “stagnation,” so I think “Dog Days” is the proper moniker for last week’s market action as all the markets stagnated! However, there is an upcoming “polarity flip,” as described in last Thursday’s Morning Tack. In that missive, I discussed the “polarity flip” whereby the sun’s polarity will actually, well, “flip.” An example would be if the North Pole’s and the South Pole’s magnetic fields changed places. Solar “flips” happen about every 11 years and coincide with dramatically increased solar activity causing sunspots, coronal mass ejections, and solar flares on the sun’s surface. In turn, such increased activity, when directed towards Earth, results in shock waves of traveling solar energetic particles causing geomagnetic storms here on Earth. Interestingly, this solar “polarity flip” is about to occur, according toYahoo.com (see it here). While I am not a believer in astrology, there is considerable evidence such events tend to have a measurable effect on a number of things. Accordingly, (at least in an exhaustive study by the Atlanta Federal Reserve) shifting magnetic fields, and the impending movements in the various equity markets following those “shifts,” can have a dramatic effect on investors, markets, electronic devices, etc. While that may seem farfetched, the attendant 53-page report from the Atlanta Federal Reserve should give some clarity to my reference last Thursday about Arch Crawford’s suggestion that solar flares do indeed effect investors attitudes since they create geomagnetic storms. As written in the Federal Reserve Bank of Atlanta’s Working Paper entitled “Playing the Field: Geomagnetic Storms and the Stock Market” published in October 2003 (see it here).
“Explaining movements in daily stock prices is one of the most difficult tasks in modern finance. This paper contributes to the existing literature by documenting the impact of geomagnetic storms on daily stock market returns. A large body of psychological research has shown that geomagnetic storms have a profound effect on people's moods, and, in turn, people's moods have been found to be related to human behavior, judgments and decisions about risk. An important finding of this literature is that people often attribute their feelings and emotions to the wrong source, leading to incorrect judgments. Specifically, people affected by geomagnetic storms may be more inclined to sell stocks on stormy days because they incorrectly attribute their bad mood to negative economic prospects rather than bad environmental conditions. Misattribution of mood and pessimistic choices can translate into a relatively higher demand for riskless assets, causing the price of risky assets to fall or to rise less quickly than otherwise. The authors find strong empirical support in favor of a geomagnetic-storm effect in stock returns after controlling for market seasonal and other environmental and behavioral factors.”
Perhaps, investors read the attendant Yahoo.com article last week and sold in anticipation of the solar “polarity flip.” Whatever the reason, the result left the D-J Industrial Average (INDU/15425.51) down 232.85 points (1.4%) for the week, while the D-J Transportation Average (TRAN/6479.63) lost 172.06 points and the S&P 500 (SPX/1691.42) shed 18.25 points (1.07%). It was the first weekly loss for the Industrials in seven weeks and reinforced what I wrote in last Monday’s letter. To wit:
“Personally, I believe what is shaping up is a giant false upside breakout pattern that would be confirmed by a close below 1700 on the SPX, and reinforced by a break below 1684. However, in this business stubbornness is a dangerous trait! Accordingly this week, and next, should tell us if my cautionary call, within the context of a secular bull market, is going to play.”
And while last week was somewhat “telling,” the SPX tested, but did not close below my key pivot point of 1684. So we enter this week still thinking it is “kiss and tell” time. In numerous missives I have given a plethora of reasons why the mid-July through mid-August timeframe is the window for the first meaningful decline of the year to begin.
Well, it’s now mid-August and earnings season is just about in the rearview mirror. Admittedly, at least not to me, earnings remain better than most expected with 62.9% of all reporting companies beating estimates (68% for the S&P 500), while 56.6% of all reporting companies beat their revenue estimates. However, with earnings season about over, there will be no upside earnings catalyst for the next few months. Nor will there be any catalyst from the Federal Reserve until their September meeting. And, while there could be some consternation out of the D.C. beltway about debt ceilings, continuing resolutions and sequestration before Congress’s early-August recess, hereto there will be a political void over the next few months. So I will say it again, “We are at the perfect window for the first meaningful decline of the year, but it is likely within the context of a new bull market.” Of course, that begs the question, “Why?”
First, purchasing managers’ reports from around the world are improving (including China) with global economic growth registering its best reading in two years. Second, conditions are in place to suggest a capital expenditure cycle is about to commence. Indeed, strong readings in the purchasing managers’ index should compel corporate America to start spending money. And third, low inflation, a stronger dollar, and a faster-than-expected reduction in the budget deficit should allow price earnings multiples to expand. But even if PE multiples don’t expand, stocks can still trade higher. Consider this, the SPX is currently trading at a PE multiple of 15.5x based on the S&P’s earnings estimate for this year of $108.81. Next year’s bottom-up operating earnings estimate is $122.43. If in 2014 the SPX trades at a PE multiple of 15.5x on that year’s earnings estimate, it implies a price objective of ~1897. So even if we get the decline I have been looking for, do not get too bearish.
Surprisingly, while most of the major indices look like they are rolling over to the downside, some of the recently shunned sectors appear to have reversed to the upside. Just look at the charts of copper and coal, certainly two of the most hated industry groups out there. Take coal, as represented by the Exchange Traded Fund (ETF) Van Eck Global Market Vectors Coal (KOL/$18.50). It looks to have bottomed and turned up (see chart).
The call for this week: This morning the pre-opening futures are off sharply (-10 points at 6:00 a.m.). But, the envisioned pullback should be used for rearranging portfolios, and for buying, because such draw-downs are typical within the confines of bull markets (see chart).